¿Es un timo el calentamiento global?

De lo que no se puede ni debe hablar en los foros
Responder
Avatar de Usuario
wynton
Admin
Mensajes: 3065
Registrado: Vie 26 Nov 2004 , 9:05
Ubicación: Madrid

Mensaje por wynton »

vicrod escribió:Será mi incapacidad de razonar, no lo dudo, aunque si es así, como comprenderas es algo que escapa a mi intencion, con lo cual tu peticion sobraba un poquito, pero en fin...
Pues precisamente este nuevo post vuelve a demostrar que no sobraba mi petición.

Vuelvo a citar a Boltzmann:
Boltzmann escribió:Existen muchas áreas de la ciencia en la que hay conflictos. Debates reales. Conflictos reales. Incluso muchos relacionados con el clima. Pero de eso nadie trae nada aquí. Ni una palabra. Porque eso que os anima a traer un debate sobre lo que no tenemos ni puta idea no existe para esas materias donde hoy hay controversia científica real. ¿Dónde está aquí el que quiere discutir sobre la energía de vacío del universo? Este debate es real. Existe en el mundo científico. ¿Dónde está aquí el debate sobre los mecanismos de la metástasis? ¿Alguien se ha preguntado qué cojones hace defendiendo una forma de negacionismo sobre un tema del que no tiene ni puta idea? ¿Y se ha preguntado qué lo ha llevado a tomar posiciones en este debate y no otro? Quizás porque este se puede asociar directamente con cuestiones extracientíficas. O quizás alguien ha tenido éxito en tratar de sacar este debate de donde corresponde.

La cosa es fácil. A veces no vale con traer artículos con apariencia de ciencia en estado puro (referencias, firmas aparentemente autorizadas, etc.). Especialmente en los casos tan populares como este. A veces es necesario además saber de lo que se habla.
vicrod escribió:Me he molestado, y sigo sin entender nada, no está explicado como para que un lego pueda ni empezar a ver el sentido de su argumento

Ponen un diagrama que segun ellos lo explica todo, que es este
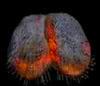
Ese diagrama está tomado de un articulo que se apoya en más de 100 referencias de primer nivel sobre el tema. Como comprenderás, para llegar al nivel de poder discutir acerca de lo que se presenta hace falta algo más que un ratillo.

El conocimiento es así. Quizás lo acabas de descubrir, hay gente que sí trabaja en paleoclimatología.

Lo que es patético es que haya que darte otro guantazo dialéctico para que asumas, a ver si de una vez por todas, que, sobre este asunto concreto de la evolución histórica del CO2 atmósferico absolutamente nada personal de interés tienes que aportar.

Es decir, que para rebatir 100 referencia de primer nivel, necesitas otras tantas de ese mismo nivel, y no un par de argumentaciones chistosas.

Es decir, que habría que trabajar, y mucho...

He ahí tu problema con skepticalscience.
Engineers like to solve problems. If there are no problems handily available, they will create their own problems. - Scott Adams.
Avatar de Usuario
wynton
Admin
Mensajes: 3065
Registrado: Vie 26 Nov 2004 , 9:05
Ubicación: Madrid

Mensaje por wynton »

This outstanding lecture by geologist Richard Alley is IMHO considered must-viewing for anyone seeking to understand the role of carbon dioxide throughout Earth's history. The lecture is The Biggest Control Knob: Carbon Dioxide in Earth's Climate History
http://www.agu.org/meetings/fm09/lectur ... A23A.shtml
Engineers like to solve problems. If there are no problems handily available, they will create their own problems. - Scott Adams.
Avatar de Usuario
Boltzmann
Admin
Mensajes: 1674
Registrado: Jue 31 Ago 2006 , 13:49
Ubicación: Madrid

Mensaje por Boltzmann »

vicrod escribió:Cuando el sistema caotico depende de una seria de atractores dinamicos, y aun más, seguramente interrelaccionados entre sí de manera compleja, estamos expuestos (no con certeza, claro, pero existe la posibilidad) a una serie de fenomenos tales como cambios de fase, rupturas de la simetria, catastrofes (en el sentido matematico), bifurcaciones, etc, etc...que mandan a tomar por saco esa certeza, y cualquier otra a largo plazo
No sé de dónde traes lo de atractores "fijos" y "dinámicos". Todo sistema caótico resulta *siempre* en atractores conocidos como extraños. Que yo sepa los atractores clásicos son los que describen los sistemas deterministas.

No controlo mucho el tema así que dejo lo de los atractores aquí. En todo caso lo que traes del "fijo" y "dinámico" no hay quien lo entienda en este contexto.

Sin embargo, la clave aquí consiste en saber si lo que se pretende predecir es parte de un sistema caótico. No se trata de saber si lloverá en Palencia al mediodía del 30 de abril de 2075. La temperatura promedio de un planeta se relaciona, *a largo plazo*, con la irradiancia solar y el efecto invernadero de su atmósfera. Full stop. Esto es tan predecible que sirven esos dos datos para calcular la temperatura promedio de cualquier planeta. Lo diré de otro modo: podemos predecir la temperatura de cualquier planeta a partir de estos dos datos. Se ha hecho y se ha contrastado con sondas en nuestro propio sistema solar. Fíjate si es predecible. Uno especialmente relevante para este caso es Venus donde el efecto invernadero lo ha llevado a ser un infierno (la irradiancia sólo es algo mayor que en la Tierra). Y ni la irradiancia solar ni las fuentes y sumideros de los gases de efecto invernadero representan modelos dinámicos caóticos. Por tanto, dadas las mínimas condiciones de equilibrio termodinámico (de ahí lo de *a largo plazo*), sólo queda por conocer la evolución de los dos datos que son el fundamento del calentamiento promedio global. Y yo que tú asumiría como cierta la hipótesis de que la radiación solar es esencialmente una constante para los próximos miles de años. De todos modos, y dado que no forman un sistema dinámico caótico, el resultado es poco sensible a los errores en los datos iniciales de la proyección.

Porque todo esto va de la temperatura promedio, ¿verdad? Pues de caótico tiene más o menos o mismo que la ley de Stefan-Boltzmann. Macroscópicamente nada.

Si las cosas fueran como tú las interpretas, yo no podría hacer la siguiente predicción: la temperatura del aire en el hemisferio norte será significativamente más alta dentro de seis meses como consecuencia de una irradiancia (no confundir con radiación) solar local mayor. Y es que la inclinación del eje de rotación de la tierra no parece formar un sistema caótico.
vicrod escribió:¡Yepa! ¡Arrribaaa!
¿?

Insisto: ¿esto del "yepa" y demás quiere decir que todos los que estudian este asunto son unos gilipollas que no saben qué es predecible y qué no lo es? ¿Que el atractor de Lorenz era un secreto que sólo se ha revelado a unos pocos negacionistas, entre ellos tú? Mira que lo intento pero no lo pillo.

Un saludo.
Memory is a self-justifying historian. The best predictor of our memories is what we believe now, not what really happened then.
Carol Tavris
Avatar de Usuario
vicrod
Mensajes: 391
Registrado: Lun 16 Jul 2007 , 21:09

Mensaje por vicrod »

wynton escribió:
Lo que es patético es que haya que darte otro guantazo dialéctico para que asumas, a ver si de una vez por todas, que, sobre este asunto concreto de la evolución histórica del CO2 atmósferico absolutamente nada personal de interés tienes que aportar.
No, lo que es patetico es que descienzas a ese nivel de groseria , en un intercambio sin importancia en un foro de audio

Y mi problema con skepticalscience es principalmente que viendo solo como califican a la pelicula del Gore, ya se les ve el plumero a la legua...no ninguna razon tecnica profunda, que como bien dices, no tengo el nivel de conocimientos para juzgar, solo para extrañarme.

Ni tú tampoco, cosa que pareces olvidar. ¿O es que tú si tienes algo personal que aportar al tema? :roll:

Pa tí la perra gorda...
Última edición por vicrod el Mar 16 Feb 2010 , 0:48, editado 1 vez en total.
Cariño...¿tienes que sonreir mientras afilas el palo?
Avatar de Usuario
vicrod
Mensajes: 391
Registrado: Lun 16 Jul 2007 , 21:09

Mensaje por vicrod »

Boltzmann escribió: En todo caso lo que traes del "fijo" y "dinámico" no hay quien lo entienda en este contexto.
No es tan dificil. Imaginate que en el experimento mental que te he puesto, las masas esas A, B y C, en vez de ser estaticas, se estuvieran moviendo, y se influenciaran gravitatoriamente unas a otras, ademas de con x

¿Seria posible en ese caso dar tantos porcientos acerca de la posicion futura de x, como se puede hacer en el caso de que sean estaticas?

Yo, lo que argumento, es que en el clima, las variables que influyen estan interrelaccionadas entre sí, con lo cual el escenario se parece más a este ultimo que al primero que he puesto, siendo ambos caoticos e impredecibles a corto plazo.
Boltzmann escribió: La temperatura promedio de un planeta se relaciona, *a largo plazo*, con la irradiancia solar y el efecto invernadero de su atmósfera.
¿A que llamas "largo plazo"?

¿Un millon de años? ¿Cien mil? ¿50?

Efectivamente, a largo plazo se podrán sacar conclusiones, supongo. Igual que en mi ejemplo, a laaaargo plazo se puede decir que todas las masas acabaran convergiendo

Pero es que los climatologos no estan hablando a largo plazo, estan hablando de efectos drasticos que se supone que vamos a ver en 20-90 años, y en base a datos que son precisos solo desde hace unas decadas...
Boltzmann escribió: Insisto: ¿esto del "yepa" y demás quiere decir que todos los que estudian este asunto son unos gilipollas que no saben qué es predecible y qué no lo es?
No, quiere decir que son humanos, y si hay algo demostrado en los humanos, es que lo sea lo que sea que creen (por los motivos que sea, culturales, sociales, economicos, etc...), el ego se encarga de buscar argumentos (a veces muy buenos, y muchas veces correctos, ¿porqué no?) que lo demuestre

¿Son gilipollas todos los que en su dia criticaban a Darwin?¿Y a Einstein? ¿Y a Galileo?

Aun más, ¿era un gilipollas Einstein por criticar la mecanica cuantica, por no ser capaz de aceptarla? (porque se murió sin hacerlo...)

Es por eso que la mejor ciencia se hace con experimentos de doble ciego, para que eso no influya...(¿de verdad estoy recordando eso en matrix?)

Lo cual en cuestiones climaticas, resulta dificil...por eso soy más esceptico acerca de esas seguridades del 90% que da el IPCC que lo esceptico que seria si estuvieran hablando de algo que se puede estudiar dentro de un laboratorio, bajo circunstancias controladas
Cariño...¿tienes que sonreir mientras afilas el palo?
Avatar de Usuario
Boltzmann
Admin
Mensajes: 1674
Registrado: Jue 31 Ago 2006 , 13:49
Ubicación: Madrid

Mensaje por Boltzmann »

vicrod escribió:No es tan dificil. Imaginate
¿Me estás contando otra vez lo de las tres bolas? Vicrod: no existen los atractores "dinámicos". Para lo que aquí interesa hay dos tipos generales de atractores: los clásicos, que no son caóticos, y los especiales, caóticos todos. Lo diré de otro modo: las bolas no se fijan nunca. Y eso no cambia sus propiedades estadísticas. Los gases no fijan sus moléculas a ningún lado (muchas de ellas ionizadas, otras son dipolos inducidos, etc.). Más fácil aún: no existen dos tipos de caos: uno con propiedades estadísticas y otro sin ellas.
Vicrod escribió:¿A que llamas "largo plazo"?
Vicrod: no lees. Equilibrio térmico. Largo plazo DESDE QUE SE FORMÓ EL PLANETA. En el caso del nuestro YA HA PASADO. Ya puedes considerar que la energía acumulada en su formación se ha disipado y que aplica la simple relación irradiancia-efecto invernadero. Ya Vicrod; ya. Desde hace algún millar de millones de años.
Vicrod escribió:No, quiere decir que son humanos, y si hay algo demostrado en los humanos, es que lo sea lo que sea que creen (por los motivos que sea, culturales, sociales, economicos, etc...), el ego se encarga de buscar argumentos (a veces muy buenos, y muchas veces correctos, ¿porqué no?) que lo demuestre

¿Son gilipollas todos los que en su dia criticaban a Darwin?¿Y a Einstein? ¿Y a Galileo?
No me lo puedo creer. Aquí tiene que haber una cámara oculta por algún lado... Nadie criticó a Darwin *porque hubiera olvidado la tabla de multiplicar*, vicrod. Nadie.

Vicrod: estás diciendo que la enorme mayoría de los físicos que se dedican profesionalmente a esto pasan por alto una cuestión básica que *todos han estudiado*. Todos estudian a Lorenz. TODOS. No existe ni uno sólo que no pueda explicarte qué es un sistema caótica y qué es predecible del clima y qué no. ¿Entiendes esto?

No es que Einstein pueda equivocarse con relación a una nueva teoría recién publicada; es como decir que Einstein se equivoca porque ha olvidado el cálculo. Ahora va a resultar que los negacionistas son los Darwin y Galileo porque ellos sí se han acuerdan de lo del caos. Tiene cojones la cosa.

Esto ya es surrealista. El ego y el cambio climático.
Vicrod escribió:¡Yepa! ¡Arrribaaa!
Memory is a self-justifying historian. The best predictor of our memories is what we believe now, not what really happened then.
Carol Tavris
Avatar de Usuario
wynton
Admin
Mensajes: 3065
Registrado: Vie 26 Nov 2004 , 9:05
Ubicación: Madrid

Mensaje por wynton »

vicrod escribió:Ni tú tampoco, cosa que pareces olvidar. ¿O es que tú si tienes algo personal que aportar al tema? :roll:
Ni lo tengo ni he "simulado" tenerlo, poniéndome a debatir sobre algo que:

- En primer lugar ni siquiera me he leido: "¿He de deducir qoe la radiacion solar se multiplico por dos en ese periodo?"
- En segundo lugar una vez leido y comprobado que no "lleva un ratillo" sigo insistiendo en argumentar sobre el tema: "Eso es un argumento circular en el mejor de los casos... "

Mi única aportación sobre el tema ha sido presentar el enlace a una web donde se enlazan, de manera organizada, referencias a publicaciones profesionales de relevancia sobre la matería, agrupadas por contrarreplicas a argumentos negacionistas.

Hay varias decenas de artículos enlazados, que en muchos casos apuntan a otras tantas referencias. Deben sumar centenares.

Solo esto, molestarme en informar, yendo a fuentes fiables, y no en ir de cantamañanas (referencias CERO son las tuyas, y por eso digo que, si no empleas los argumentos de otros será porque piensas que los tuyos son relevantes, no lo son, por cierto), es lo que a ti te motivado a decir GROSERÍAS como:
¿mandeeee?
No digo ná...
¡Yepa! ¡Arrribaaa! (y no le veo la gracia)
...sandez espectacular
veo contradicciones aparentes
eso solo prueba el ridiculo que hacen los de la pagina esta
¿A ti esto te parece educado? ¿Te parece correcto? ¿Simpático quizás? Suave ha sido la respuesta comparada con la que merecías, ya que por falta de tiempo no he entrado en más de la mitad de tus falacias.
Engineers like to solve problems. If there are no problems handily available, they will create their own problems. - Scott Adams.
Avatar de Usuario
vicrod
Mensajes: 391
Registrado: Lun 16 Jul 2007 , 21:09

Mensaje por vicrod »

Me parece coloquial, como corresponde hablando acerca del tiempo en un foro de audio...

Groseria me parece cuando te diriges particularmente a tu interlocutor, como has hecho tú conmigo...

¿Ves la diferencia?

Pero no pasa nada, te remito a otros, a sí que me disculparas si no te contesto con más detalle a tu post, es inutil caer en un dialogo de sordos, dejemos que los papeles hablen...

Para empezar, esto que trata sobre el principal tema que ha quedado sin detallar, el supuesto efecto de feedback que hace tan preocupante lo del CO2:

(Pregunta) What about the 'positive feedback' they talk about -- what's that?

Positive feedback is a multiplier effect, usually 2.5 times, added to models to make them 'wiggle fit' (reproduce previously observed temperatures) with the limited set of parameters programmed.


Due to the enormous complexity of the atmosphere and the initial conditions that must be set, ranging from solar output to the texture of the Earth's surface and its effect on wind speed, seasons, humidity, cloudiness, ocean currents and so on, models are necessarily vastly simplified compared with the real world and hence need many compromises and fudges.

Since the known physics of carbon dioxide when modeled with measured Twentieth Century changes do not produce sufficient swings to match measured 20th Century temperature trends a multiplier of 2.5 is used (said to account for increased evaporation in a slightly warmer world which, in turn, produces more water vapor greenhouse effect and more warming...).

Sounds reasonable -- we did say water vapor was the most important greenhouse gas

Yes and no. While it is intuitively reasonable that the most prolific and important greenhouse gas could act as a magnifier there is no evidence that it does. In fact water vapor is self limiting because it precipitates out as rain and snow and its effect also varies as cloud, with more bright low cloud acting as a cooling effect.

If positive feedback from water vapor was really a dominant climatic effect then it should be very easy to find, firstly by looking at an unusual event.

Depicted in the adjacent graphic is Earth's response to the 1997/98 El Niño event. These are anomalies and several of the datasets produce anomalies with reference to different base periods but that is of no particular interest here -- only the synchronous warming and subsequent cooling depicted in the atmospheric series (UAH and RSS satellite, HadAT radiosonde balloon) and near-surface land and sea surface datasets (NCDC, GISS and HadCRUT3) of ~0.9 and ~0.5 K respectively.

This warming and subsequent cooling is in addition to the normal seasonal global variation (plotted as variation from the expected monthly mean temperature in each case) and thus provides precisely the situation in which we are interested.

Since the world cooled almost as abruptly as it warmed we can only assume no positive feedback mechanism was invoked and thus Earth is not perilously perched upon some critical temperature threshold beyond which new physics takes over and runaway enhanced greenhouse warming becomes a self-perpetuating nightmare. That test for a multiplier effect surely failed.

Secondly, we know there's an annual warming, quite a severe one, in fact and that's the seasonal heating of the hemispheres. Since the Northern Hemisphere contains the greatest proportion of landmass and land heats more than oceans the Northern Hemisphere summer season causes significant increase in the global mean temperature:

There is always the possibility this temperature effect is a seasonal artifact of near-surface measurement so we should check atmospheric measures. UAH MSU data tells us the lower troposphere global mean varies somewhat less than near-surface temperature with monthly averages rising and falling approximately 2.3 °C through the year (there's no significant difference between UAH and RSS lower tropospheric data).

The Northern Hemisphere (where most people live) cycles an impressive 9.76 °C through the monthly averages as far as lower tropospheric measures are concerned and a whopping 11.6 °C according to land-based near-surface measures.

With global and hemispheric variation to this extent each and every year it is somewhat difficult to view an estimated change of 0.6 ± 0.2 °C over 120 years as being dangerous but it does seem to be the cause of considerable angst.

Nonetheless, the global troposphere warms at least 2 K from January to July every year without triggering any self-perpetuating water vapor-driven positive feedback. Surely a positive feedback should manifest under the influence of a 10 K hemispheric warming and this should be sufficient to overwhelm lack of insolation in the Southern Hemisphere winter inducing global warming and yet this doesn't happen. So much for 'positive feedback.

If that's all the anticipated greenhouse effect, where do the big warming estimates come from?
Ah, this is where it gets rather contentious because the big warming numbers come not from measurements but from computer models. These computer models and their output are passionately defended by the modeling clique and frequently derided by empiricists -- but the bottom line is that models make an enormous range of assumptions. Whether all the assumptions, tweaks and parameter adjustments really collectively add up to a realistic representation of the atmosphere is open to some conjecture (current climate models do not model "natural" climatic variation very well), but there is no evidence yet that they can predict the future with any greater certainty than a pack of Tarot cards.

Moreover, humans do a lot besides emitting greenhouse gases, changing vegetation and transpiration rates through agriculture, for example, and many effects expected to both increase and decrease regional temperatures are not included in these models.

Regardless, climate models are made interesting by the inclusion of "positive feedbacks" (the multiplier effects mentioned above) so that a small temperature increment expected from increasing atmospheric carbon dioxide invokes large increases in water vapor, which seem to produce exponential rather than logarithmic temperature response in the models. It appears to have become something of a game to see who can add in the most creative feedback mechanisms to produce the scariest warming scenarios from their models but there remains no evidence the planet includes any such effects or behaves in a similar manner.

There has been some claim we are ignoring "self-evident" positive feedbacks, which we'd be delighted to highlight if only someone could point to any such empirical measure. The bottom line, however, is that the IPCC estimates a trivial 0.6 °C ± 0.2 °C warming during the Twentieth Century. Both the GHCN-ERSST Data Set and the HadCRUT2v Data Set record the period of the 19-teens through mid-1940s as having a global trend of +0.13 °C/decade for a net warming of 0.45 °C -- leaving a mere 0.15 °C ± 0.2 °C net warming potential for the post-WWII period of significant carbon emission from fossil fuel use.

It is evident, to us at least, that if positive feedback mechanisms exist (entirely plausible) then their effect is negligible or mitigated by negative feedback mechanisms (equally plausible). Unlike modelers, who alter their virtual worlds at whim, we can only measure what the world actually does, and there simply isn't room in the measured change for the existence of significant unmitigated positive feedbacks.

As an example of how mileage may vary, as they say, we've reproduced here a table of comparisons between 108 model guess-timations for a doubling of atmospheric carbon dioxide compiled by Kacholia and Reck, published in 1997.

Note that the range of estimates spans from 0.2 °C to 8.7 °C and that the same modelers get large variations as they play with their model parameters. For example Washington and Meehl show listings of 1.3 °C; 1.4 °C–3.5 °C; 1.6 °C; 4.0 °C and back to 1.6 °C over the course of a decade. This is not highlighted as being egregious or any such thing, just frequent in this list. Charnock and Shine appear in this list (1993) with estimations of 1.5 °C–2.4 °C and we derive their 1995 discussion in Physics Today as 1.46 °C so we're in the ballpark and they may have reduced their estimate. Lindzen seems to have done so too, listed here from 1982 as 1.46 °C–1.93 °C and stating explicitly in the same Physics Today discussion that he estimated 0.5 °C for clear sky conditions and just 0.22 °C when including 40% cloud cover.

Unfortunately there has been no narrowing of the estimated range of "expected" warming from a doubling of CO2 -- in fact the range has widened even further as ever more players attempt to stand out in a crowded publication field. It isn't that the physics of carbon dioxide's radiative properties keep changing, rather that ever more imaginative "feedbacks" are shunted into the positive column to make model output more interesting. The bottom line is that you need to stuff a huge amount of CO2 into the atmosphere to get much response as more of the absorptive bands near saturation.

The modelers themselves point out that their models continue to suffer significant difficulties:


Principal Model Deficiencies

ModelE [2006] compares the atmospheric model climatology with observations. Model shortcomings include ~25% regional deficiency of summer stratus cloud cover off the west coast of the continents with resulting excessive absorption of solar radiation by as much as 50 W/m2, deficiency in absorbed solar radiation and net radiation over other tropical regions by typically 20 W/m2, sea level pressure too high by 4-8 hPa in the winter in the Arctic and 2-4 hPa too low in all seasons in the tropics, ~20% deficiency of rainfall over the Amazon basin, ~25% deficiency in summer cloud cover in the western United States and central Asia with a corresponding ~5°C excessive summer warmth in these regions. In addition to the inaccuracies in the simulated climatology, another shortcoming of the atmospheric model for climate change studies is the absence of a gravity wave representation, as noted above, which may affect the nature of interactions between the troposphere and stratosphere. The stratospheric variability is less than observed, as shown by analysis of the present 20-layer 4°x5° atmospheric model by J. Perlwitz [personal communication]. In a 50-year control run Perlwitz finds that the interannual variability of seasonal mean temperature in the stratosphere maximizes in the region of the subpolar jet streams at realistic values, but the model produces only six sudden stratospheric warmings (SSWs) in 50 years, compared with about one every two years in the real world. ... Climate simulations for 1880-2003 with GISS modelE -- Hansen et al. 2007, in press.


Why do we suspect the big warming numbers are likely wrong?
Actually, you can play with some parameters and work it out for yourselves. Since the really big guesses made by the IPCC and some truly bizarre output by climateprediction.net (CPN) are at least linear, if not exponential in their response to changes in minor trace gases we can work backwards and below you will find a pair of calculators so you can have a go.

Even before we managed to post this poor old CPN suffered a major embarrassment: Error discovered in the BBC Climate Change Experiment. Now even they know they're wildly over-guess-timating. The BBC is advising those they dragooned into the project that their model runs will be restarting here. Meanwhile, Red Tops like The Inquirer are mischievously postulating "With around 200,000 PCs running the experiment non-stop for two months, it looks very much as if the BBC experiment is making more of a contribution to global warming than scientific knowledge." Fortunately, the real world is not so easily perturbed.

Below, at left we have a linear calculator. To know how it works you just have to remember that the Earth is about 15 °C, so that's the output target you are aiming at producing at the bottom of the calculator. You know that carbon dioxide accounts for something less than 10% of the Earth's greenhouse effect so your first input is going to be a number less than or equal to that (in fact, we've limited the calculator so any greater input will be calculated as 10% and it will ignore any attempted input that is not greater than zero). The second parameter is the guess-timated warming. The output produced will be what the current global mean temperature must be for the linear increase to be as input.

At right we have a logarithmic calculator so you can play with the atmosphere to your heart's content. The calculator will always assume a base of 33 °C for the starting net greenhouse effect - it's limited to a max of 10% greenhouse effect from CO2 and a minimum of 2ppmv CO2 so you can really have a play with the atmosphere and logarithmic effect. Notice how doubling small concentrations of carbon dioxide gives large responses while the reverse also applies - enjoy! When you are finished we have some more information below the calculators.


CLIMATE SENSITIVITY
"The sensitivity of the climate system to a forcing is commonly expressed in terms of the global mean temperature change that would be expected after a time sufficiently long for both the atmosphere and ocean to come to equilibrium with the change in climate forcing. If there were no climate feedbacks, the response of Earth's mean temperature to a forcing of 4 W/m2 (the forcing for a doubled atmospheric CO2) would be an increase of about 1.2 °C (about 2.2 °F). However, the total climate change is affected not only by the immediate direct forcing, but also by climate “feedbacks” that come into play in response to the forcing."

"As just mentioned, a doubling of the concentration of carbon dioxide (from the pre-Industrial value of 280 parts per million) in the global atmosphere causes a forcing of 4 W/m2. The central value of the climate sensitivity to this change is a global average temperature increase of 3 °C (5.4 °F), but with a range from 1.5 °C to 4.5 °C (2.7 to 8.1 °F) (based on climate system models: see section 4). The central value of 3 °C is an amplification by a factor of 2.5 over the direct effect of 1.2 °C (2.2 °F). Well-documented climate changes during the history of Earth, especially the changes between the last major ice age (20,000 years ago) and the current warm period, imply that the climate sensitivity is near the 3 °C value. However, the true climate sensitivity remains uncertain, in part because it is difficult to model the effect of feedback. In particular, the magnitude and even the sign of the feedback can differ according to the composition, thickness, and altitude of the clouds, and some studies have suggested a lesser climate sensitivity."

(Climate Change Science: An Analysis of Some Key Questions, pp 6-7,
Committee on the Science of Climate Change
National Research Council)

"Climate models calculate outcomes after taking into account the great number of climate variables and the complex interactions inherent in the climate system. Their purpose is the creation of a synthetic reality that can be compared with the observed reality, subject to appropriate averaging of the measurements. Thus, such models can be evaluated through comparison with observations, provided that suitable observations exist. Furthermore, model solutions can be diagnosed to assess contributing causes of particular phenomena. Because climate is uncontrollable (albeit influenceable by humans), the models are the only available experimental laboratory for climate. They also are the appropriate high-end tool for forecasting hypothetical climates in the years and centuries ahead. However, climate models are imperfect. Their simulation skill is limited by uncertainties in their formulation, the limited size of their calculations, and the difficulty of interpreting their answers that exhibit almost as much complexity as in nature."

Y luego sobre el Calentamiento en sí, continua:

(Pregunta) Well, why is the planet warming so catastrophically if it's not CO2 then?
Who says it is warming catastrophically?


Humans have only been trying to measure the temperature fairly consistently since about 1880, during which time we think the world may have warmed by about +0.6 °C ± 0.2 °C. As we've already pointed out, the estimate of warming is less than the error margin on our ability to take the Earth's temperature, generally given as 14 °C ± 0.7 °C for the average 1961-1990 while the National Climatic Data Center (NCDC) suggest 13.9 °C for their average 1880-2004.

We are pretty sure it was cold before the 1880 commencement of record and we would probably not handle the situation too well if such conditions returned but there has been no demonstrable catastrophic warming while people have been trying to measure the planet's temperature.

If we have really been measuring a warming episode as we think we have, then setting new records for "hottest ever in recorded history" should happen just about every year -- although half a degree over a century is hardly something to write home about -- so there's really nothing exciting about scoring the highest number when looking at such a short history.

At risk of belaboring the point, the following data is from the merged land air and sea surface temperature data set (based on data from the Global Historical Climatology Network (GHCN) of land temperatures and the Comprehensive Ocean-Atmosphere Data Set (COADS) of SST data). This is the Time series: Temperature January-December, 1880 - 2005: Global Trend: 0.04 °C/decade (for the arithmetically-challenged that's 12.5 decades for a total of +0.5 °C since 1880).

The land temperature-only data (less than 30% of the planet and usually measured around cities) yields a trend of 0.07 °C/decade over the same period for a total increment of 0.875 °C.

A lot of people seem to like an idea of a specific temperature number so here's the National Climatic Data Center's monthly mean temperature record. Obviously seasonal change throughout the year dwarfs net increment over one and one-quarter centuries.

While we are talking about thermometry and measured near-surface temperatures we must underline that these accumulate to mere estimates and are fraught with difficulties.

Seven-tenths of the globe's surface is water and historical temperature series from these regions are largely based on sailors tossing a bucket on a rope over the side and then dangling a thermometer in the water hauled aboard, so coverage is basically from sea lanes and measurement somewhat, shall we say, agricultural.

Then there's the problems introduced by discontinuity in local records as observation points move over time or small towns cease to exist altogether, even gardens or the growth of adjacent trees might influence how air flows around a specific recording point and then there's changes in equipment to take into account.

Calculating what the temperature is, let alone what it has been, is no trivial task and then accumulating myriad changing locales to a global amalgam leaves much room for error.

We briefly mentioned above that much of the temperature record is derived from measurement taken where people happen to be and thus there is an increasingly urban nature to the temperature record (as rural recording sites have ceased to operate, especially over the last three decades or so). To some extent this is due to meteorological satellites as there is no longer a need to maintain remote observation outposts for the purpose of deriving surface-based weather forecasts, hence the urbanization of the near-surface temperature record. The significance of this is that there is an increasing difference between the temperatures found in the built environment and surrounding land surface - it's called the Urban Heat Island Effect (UHIE). Berkeley Lab have a good example here.

To what extent UHIE is influencing the global temperature trends we think we are measuring remains uncertain. Although curators of global temperature datasets tend to claim the effect has been eliminated through adjustments to the record, or that it is irrelevant, such claims are not entirely convincing.

There are regions where temperature records have been maintained for much longer than the 1880 commencement usually seen and these make interesting comparators. Additionally, we have some available rural and urban records from similar regions that can be viewed in parallel where we might expect similar trends if urban influence has genuinely been removed from the record. Alongside we have an example of the Armagh Observatory and Central England Temperature trends compared. Since there is no obvious reason carbon dioxide would behave differently in Northern Ireland than it does in Central England we must at least entertain the suspicion other factors are in play.

In addition to relatively subtle disparity in trends between locations we have measurements which are likely less influenced by UHIE, those taken actually in the atmosphere by instrument packs carried aloft by meteorological balloons. At left is the CDIAC radiosonde record from 1958-2004.

At right we have the Alaskan surface record classically highlighting the effect of the PDO phase shift. There is no plausible means by which accumulating greenhouse gas could effectively act as a major warming agent in one year but not in the preceding or subsequent years. There are many other datasets and attempts at measuring the temperature of the Earth ranging from satellite-mounted Microwave Sounding Units (MSUs) to meteorological station near-surface thermometer records and a comprehensive collection of these can be found here on JunkScience.com.

We would be remiss if we did not at least mention the infamous "hockey stick" representation of global temperature as estimated for Earth's recent history. The graphic linked at left comes from the IPCC's Third Assessment Report (TAR). The red "blade" section of the graphic is the same data as depicted in red on the graphic linked below, right and serves as an object lesson - always check the scale of depiction.

Notice that the graphic does not show absolute Central England Temperature as does the Armagh comparison above. Of particular significance is that the CET contains abrupt warming episodes of similar or greater magnitude early in each of the previous centuries. While it appears that the CET makes a fair proxy for Northern Hemisphere temperatures as derived by Jones and Mann this is merely speculative and constitutes no proof. It does, however, suggest great caution is warranted before attempting to extrapolate trends from a mere century or so of temperature data.

What caused the apparently massive temperature leap at the beginning of the 18th Century? It certainly wasn't industrialization, that hadn't happened yet. If such changes appear in the record during recent periods when people can not have caused them then they are by definition "natural" and, if such natural changes are evident in recent history, why are we so fixated on carbon dioxide as a "culprit" driving lesser warming now?

Finally, it is worth wondering why, with some three and one-half centuries of population growth, development and urbanization depicted in the Central England Temperature series, recent "chart-toppers" have managed to elevate top temperatures by a paltry 0.16 °C over those of the early 1730s.

The vast majority of increase in atmospheric carbon dioxide has taken place over the seventy years since the Second World War and if CO2 were a significant driver of temperature change we would expect those years to be almost exclusively represented in the highest temperatures and yet fewer than half manage to make the warmest one-hundred list.

The post hoc ergo propter hoc association of carbon dioxide is observed to increase, warmer temperatures are measured, therefore carbon dioxide warms the planet is a very poor basis for the current fixation.

So, humans aren't affecting the planet or its temperature.

Whoa! We didn't say that at all.

This discussion is on greenhouse effect and possible enhanced greenhouse, but that's a long way from anthropogenic effect in total. Whether or not they really affect global mean temperature, human endeavors have significant local effects.

The heat island effect mentioned above or the local effect of increased water vapor from large scale irrigation schemes would be good examples. Then there's land use change which can be variable depending on latitude -- replacing dark forest with wheat fields might significantly affect local albedo and cooling one region while denying shade in a more heavily irradiated region might cause ground heating through increased absorption.

There are many effects in a hugely complex system, some will be negative, some positive and all represent change, although that is neither good nor bad in and of itself. That humans affect the region of their activities is true -- that enhanced greenhouse from human activity is known to be a current or imminent catastrophe is not. And this document is only dealing with greenhouse effect and "global warming."


(sacado de http://www.junkscience.com/Greenhouse/)
-------------------------------------------------------------------------

Sobre lo que apunta Boltzmann acerca de la objetividad cientifica:

Nature experienced a little embarrassment last week when its editor-in-chief, Philip Campbell, was forced to resign from the U.K.’s “independent” inquiry into the Climategate scandal over his own blatant warmist bias. Nature, after all, is the magazine that suggested that requests for climate science data by skeptics amounted to “denialist harassment.”

Para terminar, uno de los ultimos articulos de precisamente Nature dice, muy a cuento:

“Like fans at a sporting contest, people deal with evidence selectively to promote their emotional interest in their group. On issues ranging from climate change to gun control, from synthetic biology to counter-terrorism, they take their cue about what they should feel, and hence believe, from the cheers and boos of the home crowd.”

(sacado de http://network.nationalpost.com/NP/blog ... niers.aspx)
Cariño...¿tienes que sonreir mientras afilas el palo?
Avatar de Usuario
vicrod
Mensajes: 391
Registrado: Lun 16 Jul 2007 , 21:09

Mensaje por vicrod »

Boltzmann escribió: Todos estudian a Lorenz. TODOS. No existe ni uno sólo que no pueda explicarte qué es un sistema caótica y qué es predecible del clima y qué no. ¿Entiendes esto?
En el post que acabo de poner se tocan precisamente ese y los demas puntos principales, incliyendo una argumentacion de porque muchos climatologos han caido en la tentacion de pretender saber lo que es predecible del clima, cuando no es así

En mi modestia, me perece que es un articulo serio y bien articulado, a lo mejor a ellos te los tomas en serio...
Cariño...¿tienes que sonreir mientras afilas el palo?
Avatar de Usuario
Enrike
Mensajes: 4446
Registrado: Mar 02 May 2006 , 18:02
Ubicación: Barcelona

Mensaje por Enrike »

Joder, Vicrod, acabas de redefinir el concepto "tocho" o "ladrillo" en un foro. :wink:

Saludos,
En toda empresa hay que dar dos tercios a la razón y un tercio al azar : aumentad la primera fracción y seréis pusilánimes; aumentad la segunda y seréis temerarios
Avatar de Usuario
Boltzmann
Admin
Mensajes: 1674
Registrado: Jue 31 Ago 2006 , 13:49
Ubicación: Madrid

Mensaje por Boltzmann »

Lo has vuelto a hacer. Tienes una especial habilidad para engancharte al primer cantamañanas que publica algo en la web. Ni siquiera te tomas la molestia de comprobar quién puede ser tan gilipollas como para comenzar así:
vicrod escribió:Positive feedback is a multiplier effect, usually 2.5 times,
Y ya veo que no se te ha encendido ni un pequeño aviso de alarma. Lo copias y lo pegas aquí.

Yo no puedo responder de todas las gilipolleces que se publican en Intenet. Además, no serviría para nada: sigues el principio de ignorar lo que te corrigen para traer después otra cuestión no relacionada. Pero sí me divierte el ad hominem en estos casos así que me pongo:

¿Quién es el gilipollas que escribe lo que traes? Un sujeto llamado Steven Milloy, sin ninguna formación específica en nada que se parezca a las ciencias físicas y que aparece justo donde nadie que no sea Rappel querría aparecer: en el Skeptic's Dictionary, donde podrás conocerlo un poquito para empezar. ¿Y qué defiende este individuo? Pues desde el negacionismo climático hasta el negacionismo del ozono pasando por el negacionismo de la encefalopatía espongiforme y el negacionismo de la evolución. Por negar, niega incluso que el humo del tabaco sea perjudicial. No puedo evitar traer aquí una perla (si tú lo haces...) de ejemplo de este sujeto¹:

Explanations of human evolution are not likely to move beyond the stage of hypothesis or conjecture. There is no scientific way - i.e., no experiment or other means of reliable study - for explaining how humans developed. Without a valid scientific method for proving a hypothesis, no indisputable explanation can exist.
The process of evolution can be scientifically demonstrated in some lower life forms, but this is a far cry from explaining how humans developed.
That said, some sort of evolutionary process seems most likely in my opinion. But there will probably always be enough uncertainty in any explanation of human evolution to give critics plenty of room for doubt.


En fin; un cantamañas de los que dan mucha penita. El caso es hablar; si uno no tiene ni puta idea del asunto no importa.

¿Y qué hay de la física? Después de todo, eso es de lo que habla en lo que tú traes aquí. Pues me temo que que si sabe algo más de física que DEMY no será por algo que se deduzca de su CV. Claro que eso no demuestra nada, ya sé, pero es que hay que leer cosas como estas:

So, greenhouse is all about carbon dioxide, right?

Wrong. The most important players on the greenhouse stage are water vapor and clouds. Carbon dioxide has been increased to about 0.038% of the atmosphere (possibly from about 0.028% pre-Industrial Revolution) while water in its various forms ranges from 0% to 4% of the atmosphere and its properties vary by what form it is in and even at what altitude it is found in the atmosphere.

Esta falacia me la sé. Por vieja y repetida. Sólo se le ha pasado un pequeño detalle: lo que regula la cantidad de vapor de agua en la atmósfera es el CO2 (de un modo indirecto a través del incremento de la temperatura de los océanos). Pero es que además, el vapor de agua *por sí sólo* no puede contribuir a un efecto muy prologado: al contrario que el CO2 acaba precipitando. El CO2 se mantiene mucho más porque se reabsorbe despacio en los océanos combinándose con el agua para formar ácido carbónico e inmediatamente después en una sal reduciendo el pH de los océanos (acidificando) y los otros sumideros naturales se compensan con fuentes también naturales. Una falacia de libro, vamos.

Otra:
Assuming that water vapor accounts for about 70% and clouds (mostly water droplets) accounts for another 20%, thus water in it's various forms is 90% of the total greenhouse effect, leaving 10% for non-water greenhouse effect (we know we cited 95% above -- see "important distinction"). Of this remaining 10%, mainly atmospheric carbon, humans might be responsible for 25% of the total accumulated atmospheric carbon, meaning 0.25 x 0.1 = 0.025 x 100 = 2.5% of the total greenhouse effect
Que lo responderá mejor que yo esto: http://www.realclimate.org/index.php/ar ... se-effect/.

Y así todo. Una colección de falacias y sandeces de un paleto del que encontrarás respuestas abundantes en el mismo sitio donde has encontrado lo de este imbécil: en Intenet. Pero filtra un poco, hombre. Al menos que no sea un columnista de la Foxnews. Por lo menos un aficionado a la física. Lo que sea, pero este...

Que me lo tome en serio dices... pero si es un cómico, vicrod. Pero si es cierto que buscas respuestas a las idioteces de Milloy, seguro que aquí encuentras todas: http://www.realclimate.org/.

Un saludo.
Memory is a self-justifying historian. The best predictor of our memories is what we believe now, not what really happened then.
Carol Tavris
Avatar de Usuario
wynton
Admin
Mensajes: 3065
Registrado: Vie 26 Nov 2004 , 9:05
Ubicación: Madrid

Mensaje por wynton »

vicrod escribió:Para empezar, esto que trata sobre el principal tema que ha quedado sin detallar, el supuesto efecto de feedback que hace tan preocupante lo del CO2
Vaya, vaya.... ¿así que "este" (y no otro) es el "principal tema"? Es lo bonito de las espirales argumentativas pitufas, que no se cansan nunca de sacar nuevos "temas principales" para tapar los cadaveres de los "temas principales" anteriores que quedaron pulverizados y volvieron a mostrar la altura de la cobardía intelectual del pitufo de turno.

Es bonito mientras divierte.
Due to the enormous complexity of the atmosphere and the initial conditions that must be set, ranging from solar output to the texture of the Earth's surface and its effect on wind speed, seasons, humidity, cloudiness, ocean currents and so on, models are necessarily vastly simplified compared with the real world and hence need many compromises and fudges.
Vuelta de nuevo a la confusión entre climatología y meteorología. Confusión interesada porque hay que ser muy, pero muy gilipollas, para confundirse. Por intentarlo de nuevo:

http://www.skepticalscience.com/chaos-t ... dicted.htm
Since the known physics of carbon dioxide when modeled with measured Twentieth Century changes do not produce sufficient swings to match measured 20th Century temperature trends a multiplier of 2.5 is used (said to account for increased evaporation in a slightly warmer world which, in turn, produces more water vapor greenhouse effect and more warming...).
Vuelve a aparecer el disparate del 2.5, del que todavía no hemos encontrado referencia. Es imposible saber de qué habla, ¿habla de esto?

Imagen

http://cdiac.ornl.gov/trends/temp/vostok/jouz_tem.htm

http://cdiac.ornl.gov/trends/co2/vostok.html

http://www.skepticalscience.com/co2-lag ... rature.htm

¿De esto?

Imagen

http://www.skepticalscience.com/global- ... entury.htm

http://www.skepticalscience.com/co2-tem ... lation.htm

Llegado a este punto, el autor da un salto argumental sin sentido, y nos olvidamos de su 2.5.
Sounds reasonable -- we did say water vapor was the most important greenhouse gas

Yes and no. While it is intuitively reasonable that the most prolific and important greenhouse gas could act as a magnifier there is no evidence that it does. In fact water vapor is self limiting because it precipitates out as rain and snow and its effect also varies as cloud, with more bright low cloud acting as a cooling effect.

If positive feedback from water vapor was really a dominant climatic effect then it should be very easy to find, firstly by looking at an unusual event.
Aquí estamos ante un excelente mcguffin: resulta que el efecto del vapor de agua es fácil de distinguir en primer lugar mirando algún evento "inusual". ¿Y por qué? Pues porque él lo dice y punto. Es evidente que la línea argumental va camino de concluir que los climatologos son una panda de cretinos.

Sobre el efecto del vapor de agua:

http://maths.ucd.ie/met/msc/ClimSyn/heldsode00.pdf

Por supuesto, no se basan en "eventos inusuales", aparte de ser algo conocido desde antes de que Al Gore naciera (y mira que es viejo).

Aunque hay alguna referencia al estudio de algún evento especial:

http://atoc.colorado.edu/~dcn/ATOC6020/ ... al_727.pdf

En realidad, el estudio de este evento no es clave a la hora de determinar el efecto de realimentación del vapor de agua, sino precisamente para validar, con éxito, los modelos climáticos ya desarrollados previamente.

Sobre la evolución de la concentración de vapor de agua atmosférico y su origen antropogénico:

http://www.pnas.org/content/104/39/15248.full.pdf

Quizás el modelo empleado en este artículo sea incorrecto, pero para ello al menos "hay que leerselo".

Su conclusión:

Results from 22 different climate models (virtually all of the world's major climate models) were pooled and found the recent increase in moisture content over the bulk of the world's oceans is not due to solar forcing or gradual recovery from the 1991 eruption of Mount Pinatubo. The primary driver of 'atmospheric moistening' was found to be the increase in CO2 caused by the burning of fossil fuels.

Está todo aquí, donde ya dije que estaba, por si alguien necesita leerlo:

http://www.skepticalscience.com/water-v ... se-gas.htm
Depicted in the adjacent graphic is Earth's response to the 1997/98 El Niño event. These are anomalies and several of the datasets produce anomalies with reference to different base periods but that is of no particular interest here -- only the synchronous warming and subsequent cooling depicted in the atmospheric series (UAH and RSS satellite, HadAT radiosonde balloon) and near-surface land and sea surface datasets (NCDC, GISS and HadCRUT3) of ~0.9 and ~0.5 K respectively.

This warming and subsequent cooling is in addition to the normal seasonal global variation (plotted as variation from the expected monthly mean temperature in each case) and thus provides precisely the situation in which we are interested.

Since the world cooled almost as abruptly as it warmed we can only assume no positive feedback mechanism was invoked and thus Earth is not perilously perched upon some critical temperature threshold beyond which new physics takes over and runaway enhanced greenhouse warming becomes a self-perpetuating nightmare. That test for a multiplier effect surely failed.
Nuevo salto argumental, ahora presentamos a "El Niño", un "evento singular" (hay que joderse) que los climatólogos seguramente obvian en sus estudios porque, logicamente, no tienen ni idea de clima. Como ahora veremos....

Con vuestro permiso voy a hacer algo productivo por hoy y ya en otro momento pasaremos a El Niño, La Niña y lo que haya escrito en sus delirios el autor de este desatino.
Engineers like to solve problems. If there are no problems handily available, they will create their own problems. - Scott Adams.
Avatar de Usuario
wynton
Admin
Mensajes: 3065
Registrado: Vie 26 Nov 2004 , 9:05
Ubicación: Madrid

Mensaje por wynton »

Seguimos:
Since the world cooled almost as abruptly as it warmed we can only assume no positive feedback mechanism was invoked and thus Earth is not perilously perched upon some critical temperature threshold beyond which new physics takes over and runaway enhanced greenhouse warming becomes a self-perpetuating nightmare. That test for a multiplier effect surely failed.
No hay tal "mecanismo de realimentación", nos informa el experto. Simplemente es que estos tipos se olvidaron de El Niño:

http://www.skepticalscience.com/el-nino ... lation.htm

This view is confirmed in other analyses. An examination of the temperature record from 1880 to 2007 finds internal variability such as El Nino has relatively small impact on the long term trend (Hoerling 2008). Instead, they find long term trends in sea surface temperatures are driven predominantly by the planet's energy imbalance.

The El Niño Southern Oscillation is an internal phenomenon where heat is exchanged between the atmosphere and ocean and cannot explain an overall buildup of global ocean heat. This points to an energy imbalance responsible for the long term trend (Wong 2005).

Imagen

Imagen

In 1998, an abnormally strong El Nino caused heat transfer from the Pacific Ocean to the atmosphere. Consequently, we experienced above average surface temperatures. Conversely, the last few years have seen moderate La Nina conditions which had a cooling effect on global temperatures. And the last few months have swung back to warmer El Nino conditions. This has coincided with the warmest June-August sea surface temperatures on record. This internal variation where heat is shuffled around our climate is the reason why surface temperature is such a noisy signal.


Extraido de:

http://www.realclimate.org/index.php/ar ... er-warmth/

If a particular seasonal anomaly appears to be related to El Nino, can we conclude that climate change played no role at all? Obviously not. It is possible, in fact probable, that climate change is actually influencing El Nino (e.g. favoring more frequent and larger El Nino events), although just how much is still very much an issue of active scientific debate. One of the key remaining puzzles in the science of climate change therefore involves figuring out just how El Nino itself might change in the future, a topic we’re certain to discuss here again in the future.
Engineers like to solve problems. If there are no problems handily available, they will create their own problems. - Scott Adams.
Avatar de Usuario
wynton
Admin
Mensajes: 3065
Registrado: Vie 26 Nov 2004 , 9:05
Ubicación: Madrid

Mensaje por wynton »

If that's all the anticipated greenhouse effect, where do the big warming estimates come from?
Ah, this is where it gets rather contentious because the big warming numbers come not from measurements but from computer models. These computer models and their output are passionately defended by the modeling clique and frequently derided by empiricists -- but the bottom line is that models make an enormous range of assumptions. Whether all the assumptions, tweaks and parameter adjustments really collectively add up to a realistic representation of the atmosphere is open to some conjecture (current climate models do not model "natural" climatic variation very well), but there is no evidence yet that they can predict the future with any greater certainty than a pack of Tarot cards.
El efecto invernadero no es algo que demuestre simulación alguna, es algo sostenido por evidencias:

Imagen


Figure 1: Comparison of climate results with observations. (a) represents simulations done with only natural forcings: solar variation and volcanic activity. (b) represents simulations done with anthropogenic forcings: greenhouse gases and sulphate aerosols. (c) was done with both natural and anthropogenic forcings (IPCC).

http://www.skepticalscience.com/climate-models.htm

Y no hay "un modelo" sino que se trabaja con muchos de ellos, y solo ajusta a los datos medidos aquel que incluye el efecto antropogénico de la emisión de CO2:

http://www.ipcc.ch/ipccreports/tar/wg1/pdf/TAR-12.PDF


Imagen

In 1988, James Hansen projected future temperature trends (Hansen 1988). Those initial projections show good agreement with subsequent observations (Hansen 2006).

http://pubs.giss.nasa.gov/docs/1988/198 ... n_etal.pdf

http://pubs.giss.nasa.gov/docs/2006/200 ... etal_1.pdf

Efectivamente, el ajuste no es perfecto: precisamente por aquellos fenomenos singulares derivados del caracter aleatorio de ciertos patrones meteorológicos. Es decir, que gracias a que "saben lo que hacen", los modelos de los climatólogos no predicen aquello "que no es predecible" en la variabilidad climática, pero, sin embargo son capaces de hacer un correcto seguimiento de aquello que es "tendencia no explicable en la propia variabilidad meteorológica".

Y finalmente, volvemos al punto inicial. Toda esta discusión solo está en la mente de aquel que no distingue meteorología de climatología:

http://www.skepticalscience.com/weather ... ctions.htm

En resumen, los negacionistas de este corte (los hay peores) parten de una falacia de raiz, la sostienen hasta el final y el resultado es que da igual dónde miren, qué dato analicen, no hay salida para aquellos que parten de un punto incorrecto. Es como querer corregir el castellano de un libro escrito en ruso.

Obviamente, bajo esta perspectiva, uno de los dos grupos es estúpido: o los climatologos o los negacionistas. Cada cual que haga sus apuestas.

Por curiosidad, en algunos casos, los modelos han subestimado el efecto invernadero:

Imagen

Nobody's perfect.
Engineers like to solve problems. If there are no problems handily available, they will create their own problems. - Scott Adams.
Avatar de Usuario
wynton
Admin
Mensajes: 3065
Registrado: Vie 26 Nov 2004 , 9:05
Ubicación: Madrid

Mensaje por wynton »

Proseguimos analizando los delirios de quien insiste en demostrar que no tiene claros ni los más básicos conceptos de climatología.
Secondly, we know there's an annual warming, quite a severe one, in fact and that's the seasonal heating of the hemispheres. Since the Northern Hemisphere contains the greatest proportion of landmass and land heats more than oceans the Northern Hemisphere summer season causes significant increase in the global mean temperature:
Insiste el tipo en confundir meteorología y climatología. Llegado este punto uno se pregunta si vicrod es tan gilipollas como para creer que los climatólogos no saben distinguir verano de invierno.

Asimismo he subrayado la más sensacional GILIPOLLEZ de este texto hasta ahora.

http://www.npr.org/templates/story/stor ... d=88520025

But Josh Willis at NASA's Jet Propulsion Laboratory says the oceans are what really matter when it comes to global warming.

In fact, 80 percent to 90 percent of global warming involves heating up ocean waters. They hold much more heat than the atmosphere can.


Justo lo contrario, donde se acumula calor es en las aguas oceanicas.

Me pregunto cómo habrá llegado vicrod a semejante fuente de memeces y cual era el objetivo real de presentarlo aquí. Me pregunto si realmente es como parece y piensa que somos tontos del culo, o hay otra explicación más triste de su torpe comportamiento.

Por cierto este es Josh Willis:

http://science.jpl.nasa.gov/people/Willis/

Parece que sabe de lo que habla. Seguimos con el texto publicado por NPR recogiendo sus palabras:

In recent years, heat has actually been flowing out of the ocean and into the air. This is a feature of the weather phenomenon known as El Nino. So it is indeed possible the air has warmed but the ocean has not. But it's also possible that something more mysterious is going on.

Queda claro que los climatólogos ya saben cómo "descontar" a El Niño de sus valoraciones de cambio climático antropogénico.

That becomes clear when you consider what's happening to global sea level. Sea level rises when the oceans get warm because warmer water expands. This accounts for about half of global sea level rise. So with the oceans not warming, you would expect to see less sea level rise. Instead, sea level has risen about half an inch in the past four years. That's a lot.

Estimaciones de la subida del nivel del mar:

Imagen

http://sealevel.colorado.edu/

Imagen

Nuestro pitufo negacionista ha decido obviar las muestras evidentes y se dedica a marear la perdiz sobre el calentamiento estacional de la superficie terrestre.
There is always the possibility this temperature effect is a seasonal artifact of near-surface measurement so we should check atmospheric measures. UAH MSU data tells us the lower troposphere global mean varies somewhat less than near-surface temperature with monthly averages rising and falling approximately 2.3 °C through the year (there's no significant difference between UAH and RSS lower tropospheric data).
Comentario irrelevante. Todos entendemos que existe el verano y existe el invierno.
The Northern Hemisphere (where most people live) cycles an impressive 9.76 °C through the monthly averages as far as lower tropospheric measures are concerned and a whopping 11.6 °C according to land-based near-surface measures.
Aqui vuelvo a preguntarme si vicrod se ha leido esto y no ha sospechado que su autor debe tener delirios pueriles de creerse experto de lo que no entiende ni en su forma más básica. ¿Qué importancia tiene que haya más gente en el Hemisferio Norte que en el Sur?
With global and hemispheric variation to this extent each and every year it is somewhat difficult to view an estimated change of 0.6 ± 0.2 °C over 120 years as being dangerous but it does seem to be the cause of considerable angst.
Y vuelta a empezar: como confunde meteorología y climatología supone que las naturales variaciones meteorológicas verano/invierno hacen imposible predecir el calentamiento CLIMÁTICO.

Así que, otra vez, pego enlace y texto:

http://www.skepticalscience.com/climate-models.htm

A common argument heard is "scientists can't even predict the weather next week - how can they predict the climate years from now". This betrays a misunderstanding of the difference between weather, which is chaotic and unpredictable, and climate which is weather averaged out over time. While you can't predict with certainty whether a coin will land heads or tails, you can predict the statistical results of a large number of coin tosses. In weather terms, you can't predict the exact route a storm will take but the average temperature and precipitation will result the same for the region over a period of time.
Engineers like to solve problems. If there are no problems handily available, they will create their own problems. - Scott Adams.
Avatar de Usuario
wynton
Admin
Mensajes: 3065
Registrado: Vie 26 Nov 2004 , 9:05
Ubicación: Madrid

Mensaje por wynton »

Así se miden salinidad y temperaturas oceánicas (hasta 2000 m):

http://www.argo.ucsd.edu/
Since Argo data are made freely available we ask that where Argo data are used in a publication or product, the following acknowledgement is given:


" These data were collected and made freely available by the International Argo Project and the national programs that contribute to it. (http://www.argo.ucsd.edu, http://argo.jcommops.org). Argo is a pilot program of the Global Ocean Observing System."


If you plan to use or are using Argo data, the Argo Steering Team requests that, as a courtesy, you inform the groups responsible for the floats that you are using of the type of study you are undertaking. You can find who to contact by going to argo.jcommops.org to the quick link "Find floats" and enter the WMO or Telecom ID.
Engineers like to solve problems. If there are no problems handily available, they will create their own problems. - Scott Adams.
Avatar de Usuario
wynton
Admin
Mensajes: 3065
Registrado: Vie 26 Nov 2004 , 9:05
Ubicación: Madrid

Mensaje por wynton »

Así se miden los niveles y su subida:

http://sealevel.jpl.nasa.gov/mission/jason-1.html
Jason-1 completes its 5th year on orbit on 7 December 2006. From its vantage point 1,330 kilometers (860 miles) above Earth, this follow-on to the highly successful TOPEX/Poseidon mission has provided measurements of the surface height of the world's oceans to an accuracy of 3.3 centimeters (1.3 inches). With this milestone, Jason-1 surpasses both its primary and extended mission phases and continues to collect valuable ocean data for researchers and operational users worldwide.
Engineers like to solve problems. If there are no problems handily available, they will create their own problems. - Scott Adams.
Avatar de Usuario
Boltzmann
Admin
Mensajes: 1674
Registrado: Jue 31 Ago 2006 , 13:49
Ubicación: Madrid

Mensaje por Boltzmann »

Una interesante entrevista (podcast) con un investigador en la aplicación de técnicas estadísticas para el estudio de la variabilidad y el cambio del clima¹.

Si el inglés no es un problema y se tiene un poco de curiosidad por este fenómeno tan curioso por el que de pronto aparecen por el mundo millones de expertos espontáneos del clima denunciando² la gran mentira de miles de científicos: http://media.libsyn.com/media/pointofin ... l_Mann.mp3.

Dr. Michael E. Mann is a member of the Pennsylvania State University faculty, and director of the Penn State Earth System Science Center. His research focuses on the application of statistical techniques to understanding climate variability and change, and he was a Lead Author on the “Observed Climate Variability and Change” chapter of the Intergovernmental Panel on Climate Change (IPCC) Third Scientific Assessment Report. Among many other distinguished scientific activities, editorships, and awards, Mann is author of more than 120 peer-reviewed and edited publications. That includes, most famously, the 1998 study that introduced the so called “hockey stick,” a graph showing that modern temperatures appear to be much higher than anything seen in at least the last thousand years. With his colleague Lee Kump, Mann also recently authored the book Dire Predictions: Understanding Global Warming.

Un saludo.
¹ Con la esperanza de que, siendo esa su especialidad y a diferencia del resto de sus colegas, no se haya olvidado ya de qué es predecible y qué no.

² "¡Yepa! ¡Arrribaaa!"
Memory is a self-justifying historian. The best predictor of our memories is what we believe now, not what really happened then.
Carol Tavris
Avatar de Usuario
Kir
Site Admin
Site Admin
Mensajes: 4706
Registrado: Sab 25 Oct 2003 , 20:40
Ubicación: Tuerto del tercer ojo
Contactar:

Una menos

Mensaje por Kir »

El escándalo del climagate no era tal escándalo, según dicen las ultimas investigaciones independientes. No hubo manipulacion de los datos ni mala praxis científica

http://www.elpais.com/articulo/sociedad ... soc_12/Tes

http://www.abc.es/20100415/sociedad/can ... 51423.html

Pongo dos fuentes con ideas opuestas para que se vea que la información no está sesgada.
Kir

Tuerto del tercer ojo.
Avatar de Usuario
Luismax
Site Admin
Site Admin
Mensajes: 7081
Registrado: Lun 03 Nov 2003 , 18:44
Ubicación: MatrixHell
Contactar:

Mensaje por Luismax »

No pasa nada... tenemos un volcán en erupción que va a hacer bajar la temperatura global, para compensar :lol:

Las cenizas del volcán islandés pueden enfriar la temperatura global
Efe | Viena Actualizado viernes 16/04/2010 10:44

Las cenizas del volcán del glaciar Eyjafjällajokull en Islandia, que han paralizado gran parte del espacio aéreo de Europa, podrían influir sobre el clima de la Tierra si alcanzan la estratosfera, según ha asegurado un experto austríaco.

Si las partículas de ceniza del volcán islandés alcanzan la estratosfera, eso podría tener durante varios años "un efecto refrigerador" porque reduciría la radiación solar, según aseguró el climatólogo de la Universidad de Viena Herbert Formayer a la radio pública austriaca ORF.

La estratosfera es la segunda capa de la atmósfera y comienza a unos 12 kilómetros de altura sobre la superficie de la Tierra.

"A esa altura no hay lluvias que puedan reducir o 'lavar' las partículas, por lo que las cenizas puede permanecer allí durante dos o tres años", manifestó el experto de la Universidad de Viena.

"Durante esa época se reduce la radiación del sol y eso tiene un efecto refrigerador", explicó Formayer.

Este fenómeno ya se produjo en 1991 con la erupción del monte Pinatubo, en Filipinas, "cuando sus cenizas llegaron a dar la vuelta al mundo y eran perceptibles muchos meses después del desastre", ha explicado Joan Martí, secretario general de la Asociación Internacional de Vulcanología.

"Aquel desastre tuvo consecuencias incluso climáticas porque hizo descender la temperatura global al reflejar la luz solar hacia el espacio", manifestó Martí.
“No es señal de buena salud estar bien adaptado a una sociedad profundamente enferma”
Responder